
Why Should I Use Power BI?
Discover the top 25 benefits of using Power BI to visualise your data, provide actionable insights,
real-time analytics, and cost-effective solutions.
Power BI Essentials
1 Day
Duration
Beginners
Level
AU$360+GST
per person
Course Overview
This one-day Power BI Essentials course provides participants with the skills needed to create, analyse, and distribute reports and dashboards using Microsoft Power BI. Throughout the training, learners will work with sample Excel datasets to explore the core capabilities of Power BI and understand the concepts that make Power BI Desktop a leading business intelligence and data visualisation platform.
By the end of the course, participants will have developed a strong practical understanding of Power BI fundamentals, enabling them to confidently build reports and dashboards and prepare for more advanced Power BI training.
Audience
This course is designed for Excel users seeking to introduce business intelligence solutions into their reporting processes, as well as SQL Server report developers who are looking for alternative and more dynamic ways to visualise and present data.
Course Prerequisites
The Power BI Essentials course is intended for individuals with little or no previous experience using Microsoft Power BI. To gain maximum value from the training, attendees should have a working knowledge of Microsoft Excel, including experience with features such as PivotTables and VLOOKUP functions.
While not essential, a basic understanding of common business concepts – including financial reporting, revenue analysis, and profitability metrics – will be beneficial when working through the course examples and exercises.
Registering Multiple Participants?
A 10% discount will be automatically applied when registering two or more participants for a course.
Do you have 5 or more participants?
Private courses are more cost-effective if you're looking to upskill 5 or more people.
Prerequisites
N/A
Alternative Courses
Excel Data Analysis

Next Steps...
Power BI Report Design
Power BI Advanced
Course Modules
Module 1: Understanding Business Intelligence
- Why is Data Analytics Important?
- Why is conventional Data Analysis Process inefficient?
- What is Business Intelligence?
- Steps & concepts involved in Business Intelligence
- Other BI Tools in the Market
- What is Self Service BI?
Module 2: Understanding Power BI
- Power BI (Desktop Vs Mobile Vs Service)
- Licenses (Free Vs Pro Vs Premium)
- What makes Power BI different from other BI Tools?
- Frequent Updates and Changes
- BI Steps in Power BI
- Languages Involved in Power BI (Power Query, DAX, R)
Module 3: Understanding Power BI
- Power BI (Desktop Vs Mobile Vs Service)
- Licenses (Free Vs Pro Vs Premium)
- What makes Power BI different from other BI Tools?
- Frequent Updates and Changes
- BI Steps in Power BI
- Languages Involved in Power BI (Power Query, DAX, R)
Module 4: Getting Started with Power BI
- Setting up Office 365 Enterprise E3 trial account
- Signing up for Power BI
- Upgrading to Power BI PRO
- Downloading Power BI Desktop
Module 5: Getting Data in Power BI Desktop
- Understanding Power BI Navigation
- Exploring Different Data Sources in Power BI
- Getting Data from Web
- Getting Data from Azure SQL Data base
- Getting Data from Azure SQL Database using SQL statement
- Getting Data from Access File
- Getting Data from Excel
Module 6: Data Transformation
- Navigating Query Editor
- What is Query?
- What is Data Transformation?
- Removing empty rows
- Removing irrelevant Columns
- Renaming Columns
- Changing Data Types
- Duplicating Columns
- Splitting Columns
- Merging Columns
- Correcting Spelling Mistakes
- Changing cases
- Trimming & Cleaning
Module 7: Introduction to Power Query (M Formula Language)
- Exploring Applied Steps
- Introducing idea of repeatable workflows
- Updating Applied Steps
- Deleting Applied Steps
- Renaming Applied Steps
- Understanding the Code behind every step
- Automating Data Transformation process via repeatable workflows
- Exploring Advanced Editor
- Loading and Applying Data
Module 8: Data Modelling
- Understand Navigation of Relationship view
- What is Data Model?
- What is a unique Identifier?
- Creating a new relationship
- Editing a relationship
- Updating a relationship
- Understanding Cardinality
- Understanding Cross Filter Direction
- Why is Data Model more efficient than a Flattened Data Set?
Module 9: Introduction to DAX
- What can we calculate using DAX?
- What is Calculated Columns and Calculated Measure?
- How is DAX different from Excel Functions?
- Calculating a column using DAX
- Calculating a measure using DAX
- Formatting Data types
- Changing property of a Data Type
Module 10: Data Visualisation
- Understand Navigation of Report View
- Creating a Bar Chart
- Formatting a Bar Chart
- Changing Chart Type
- Creating and Formatting a Column Chart
- Creating and Formatting a Line Chart
- Creating and Formatting a Pie Chart
- Creating and Formatting a Tree Chart
- Creating and Formatting a Card
- Creating and Formatting a Matrix
- Creating and Formatting a Table
- Creating and Formatting BubbleMap Visualization
- Creating a Filled Map Visualisation
Module 11: Creating Custom Visuals
- Getting Custom Visuals from the Store
- Creating Sankey Chart
- Creating Radar Chart
Module 12: Visual Interaction
- Understanding Visual Interaction
- Turning visual interaction on and off
Module 13: Exploring Filters
- Cross Filtering through visuals
- Creating a slicer
- Visual level filter
- Page Level Filter
- Report Level Filter
- Drill through filter
- Top N Filter
Module 14: Creating Custom Slicers
- Getting Custom Slicer From Store
- Creating Enlighten Word Flag Slicer
- Creating Chiclet Slicer
- Inserting Images in Chiclet Slicer
Module 15: Exploring Power BI Desktop Features
- Exploring visual options (focus mode, show data, spotlight, export)
- Create and Duplicate New Pages
- Create image, text boxes and shapes
- Switch between phone and web layout
- Save the report
- Print the report
- Publish report to Power Bi Service
Module 16: Power BI service Features
- Log in to Power BI Service
- Understand Navigation
- Opening and Editing your report in Power BI service
- Publishing to web
- Converting report to a Power Point
- Generating a QR Code
- How to get Data directly into Power Bi Service
- Importing Data Vs Uploading Data
Module 17: Dashboard
- Pin visuals from report to dashboard
- Difference between report and dashboard
- Why visual interaction isn’t supported in Dashboards
- Resizing and moving a visual
- Creating a video tile
- Creating an image tile
- Applying alert on Card
- Pinning complete report to Dashboard
- Customizing dashboard for mobile view
- Sharing dashboard with colleagues
- Viewing Shared Reports
Module 18: Natural Language Query
- What is NLQ and why is it a breakthrough
- Create a Card using NLQ
- Create a Table Using NLQ
- Create Bar Visual Using NLQ
- Pin the visuals directly to your dashboard
Module 19: Power BI publisher for Excel
- Installing the Add-in
- Activating this Add-in in Excel
- Connect your Excel Workbook with Power Bi
- Pin a chart from Excel to Power BI Dashboard
- Pin a pivot table from Excel to Power BI Dashboard
- Update the Chart in Power BI Dashboard from Excel
Module 20: Quick Insights
- What is Quick Insight Tool?
- How to create quick insights of a dataset
- Explore visuals created by this option
- Pin a visual to dashboard
Module 21: Sample Reports and Dashboard
- Getting the Sample reports and Dashboard
- How samples are very helpful?
- Editing sample reports and dashboard
Module 22: Power BI Mobile
- Downloading Power BI mobile app and logging in
- Understand Navigation
- How to see underlying reports
- Annotate visuals and share using other apps
- How to see our own dashboard
- How to see dashboard shared with us
- See report using QR scanner
- Exploring mobile sample reports
Upcoming Dates...
Related Courses...
Course Inclusions...
Certified Trainers
All our trainers are Microsoft 365 experts in their own right, and must first be qualified to teach in our own World Education Alliance (WEA) Training Certification Program before delivering any of our courses.
We feel that it is important that all of the trainers and instructors can take their real-world experiences into the classroom, in order to ensure that they are well equipped to respond to any queries and questions which may be put their way, as well as give accurate and relevant guidance in the most appropriate methods to leverage the technology which SharePoint and its related tools provide.
Course Materials Provided
Our Microsoft 365 courseware is known as being some of the best training materials in the world.
FREE Email Support
We offer free post-course support with all of our courses, available via email, telephone, or our Viva Engage community.
FREE Re-sits within 10 Months
Once you've attended any of our public courses, you can re-sit the same course as many times as you like within the next 10 months, as long as your re-sit course has reached the minimum number of paid attendees required to go ahead.
Certificate of Completion
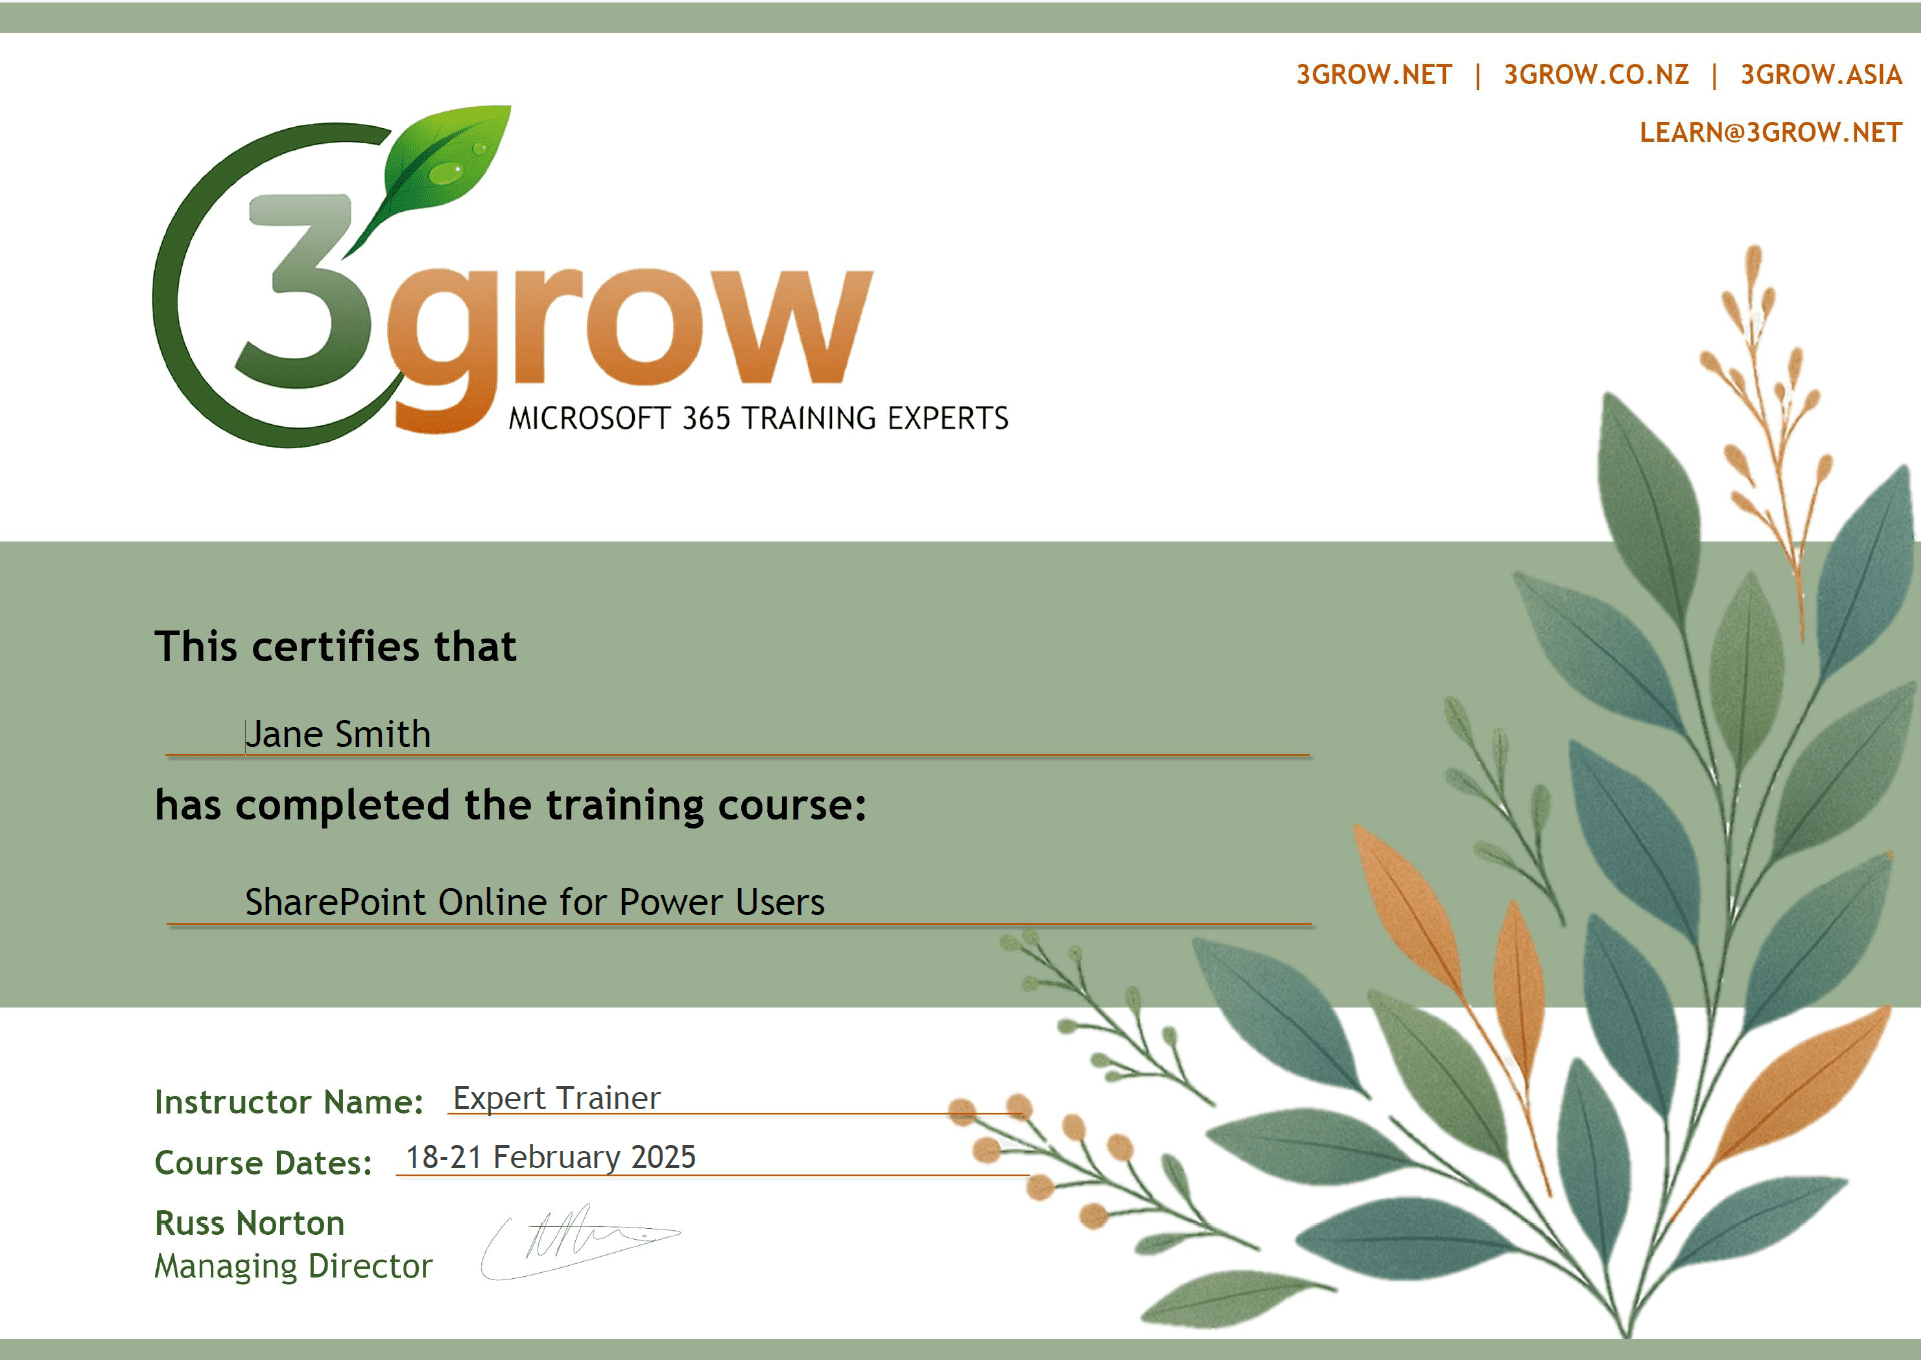
Anyone attending a 3grow course will be provided with a personalised certificate of completion.
Get Hands-on Experience
All 3grow courses include plenty of hands-on experience, delivered via a combination of instructor-led follow-along demos and comprehensive lab exercises.
Personal Class Sizes
Although we allow a maximum of only 10 attendees on our public courses, the average is around 5 students, therefore each participant will leave the course feeling like they received the personal attention they deserve.
Power BI FAQs
What is Power Query?
Power Query is a data connection technology that enables you to discover, connect, combine, and refine data across a wide variety of sources. Read this detailed article by Microsoft for a more in-depth look at Power Query
What is DAX?
DAX (Data Analysis Expressions) is a formula language used in Power BI for creating custom calculations in your data models.
Can I share my reports and dashboards with others?
Yes, Power BI allows you to publish and share your reports and dashboards with colleagues and stakeholders through Power BI Service.
What types of visualizations can I create in Power BI?
You can create various visualizations including bar charts, line charts, pie charts, maps, and more. The course covers how to customize these visuals to best represent your data.
See visualization types for more information
What is data modeling in Power BI?
Data modeling involves creating relationships between different data tables and using DAX to create calculated columns and measures. This helps in organizing and structuring your data for better analysis.

